ELK Stack in 25 minutes with Docker

Let's say you've got an application which outputs log files to a directory. Somewhere on your server is a file called applog_20151116.log, which contains a whole bunch of unstructured log entries output by your application - debug statements, errors, exceptions, stack traces and all sorts mixed up in one big file. Something like, say, the following:
2015-11-16 03:44:41,322 ERROR: [MyApplication.Internal.Client.MyApplicationClient] Application callback encountered an error, Thing Id: '293377143', Http Status Code: 'NotFound', Response Content: ''
2015-11-16 08:11:55,105 ERROR: [MyApplication.Internal.Client.MyApplicationClient] Application callback encountered an error, Thing Id: '303350367', Http Status Code: 'NotFound', Response Content: ''
2015-11-16 09:41:44,914 WARN : [Auther.Internal.Api.Filters.AutherApiAuthorizeAttribute] OnAuthorization - Token is Invalid or Expired, Controller: 'Client', Action: 'Get' System.Security.SecurityException: Token is expired
at AwesomeCorp.JWT.TokenEncoding.TokenEncoder.DecodeWithValidation(String input)
at Auther.Internal.Api.Filters.AutherApiAuthorizeAttribute.OnAuthorization(HttpActionContext actionContext)
2015-11-16 13:39:34,199 ERROR: [MyApplication.Internal.Client.MyApplicationClient] Conflict: ErrorDuplicateRecord: Duplicate member reference;
2015-11-16 13:46:52,113 ERROR: [MyApplication.Internal.Client.MyApplicationClient] Application callback encountered an error, Thing Id: '293326249', Http Status Code: 'NotFound', Response Content: ''
2015-11-16 22:54:31,958 ERROR: [MyApplication.Internal.Client.MyApplicationClient] Application callback encountered an error, Thing Id: '303336390', Http Status Code: 'NotFound', Response Content: ''
```
On its own, this is not particularly useful. Logs sitting on a server are marginally better than no logs at all, but all you're really gaining is the ability to jump on a production box and do some forensics when someone notices something's gone wrong. You don't get any advance warning that error rates are up or a new component is regularly falling over. You can't aggregate data to analyse long-term trends.
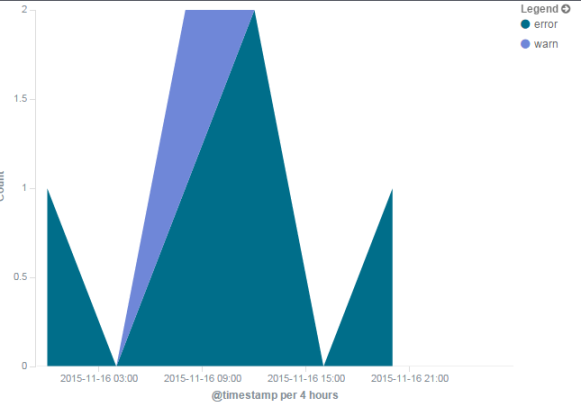
Wouldn't something like this be far more useful?

This chart comes from [Kibana](https://www.elastic.co/products/kibana), one component of the ELK stack - [ElasticSearch](https://www.elastic.co/products/elasticsearch), [Logstash](https://www.elastic.co/products/logstash) and [Kibana](https://www.elastic.co/products/kibana). Setting up an ELK stack is a huge step forward in being able to see what your applications are doing. It doesn't replace alerts and monitoring, but as a way to observe long-term trends or be able to dive into a particular series of errors, it's a huge step up compared to jumping on your production box and dragging up some text files.
What's more impressive is that you can set this all up in less time than it takes to produce decent macaroni and cheese. All you need is:
* A spare Linux box or VM with kernel >= 3.10
* Docker >= 1.7.1
* Docker Compose >= 1.5.0
If you're setting these up for the first time, I recommend using William Yeh's [Vagrant boxes](https://github.com/William-Yeh/docker-enabled-vagrant), or you can follow [my guide on setting up Docker on AWS](http://mattkimber.co.uk/setting-up-docker-and-docker-compose-on-aws/) if you're running things there.
What we're going to do is use *docker-compose* in order to set up a stack of the three components in such a way that they can talk to each other, without having to spend ages installing software, configuring network settings, or opening ports. You can grab the files from my [git repository](https://github.com/mattkimber/elkstack-1/), or create them as we go along - I recommend the latter, so you get a better understanding of each component.
#### Setting up the components
Firstly, create a new directory. Then create a file called "docker-compose.yml", containing the following:
elasticsearch:
image: elasticsearch:2.0.0
command: elasticsearch -Des.network.host=0.0.0.0
ports:
- "9200:9200"
logstash:
image: logstash:2.0.0-1
command: logstash -f /etc/logstash/conf.d/logstash.conf
volumes:
- ./logstash:/etc/logstash/conf.d
ports: - "5000:5000"
links:- elasticsearch
kibana:
image: kibana:4.2.0
ports: - "5601:5601"
links: - elasticsearch
- elasticsearch
**Note**: use spaces rather than tabs for the indentation. The YAML format forbids tab indentation due to the inconsistent ways different editors handle them, and you'll get an error if you try to tab-indent your configuration lines.

Anyway, let's step through the file. At the root level of indentation, you're setting up three containers: **elasticsearch**, **logstash** and **kibana**. Under the **image** element we're requesting specific versions of each here to avoid future changes rendering this tutorial incorrect. It's usually a good idea to do this even if you're not following a tutorial - it insulates you from breaking changes to an application, and makes it easier to perform a security audit of what versions you're running - but you can replace those with 'latest' if you want to keep at the bleeding edge no matter what.

Two of the containers have a specific command.

* We tell elasticsearch to serve on any interface.  This simplifies our container setup.
* We tell logstash to read a specific configuration file.  (More on this later).

Also note that we forward the default ports from each container, and we link the *kibana* and *logstash* containers to ElasticSearch. Logstash will push the data it reads to ElasticSearch, and Kibana will read it from there - Kibana doesn't need to talk directly to Logstash, so there's no link required for that.

#### Creating the Logstash configuration

Next we need to create a configuration file for logstash. That's what we set up in "volumes" in the compose file - we tell the container that instead of getting the */etc/logstash/conf.d* directory from its own internal filesystem, it should get it from *./logstash* on the host's filesystem. The reason for this is that we want to inject our own configuration.

Create the logstash directory, then edit ./logstash/logstash.conf:
input {
tcp {
port => 5000
}
}
filter {
multiline {
pattern => "^%{TIMESTAMP_ISO8601}"
negate => true
what => previous
}
grok {
match => { "message" => "\A%{TIMESTAMP_ISO8601:timestamp} %{LOGLEVEL:severity}%{SPACE}: [%{JAVACLASS:assembly}] %{GREEDYDATA:details}" }
}
date {
match => [ "timestamp", "YYYY-MM-dd HH:mm:ss,SSS" ]
}
}
output {
elasticsearch {
hosts => "elasticsearch:9200"
}
}
There are three stages to this simple logstash configuration:
* **input** - where we get the data from. In this case, we simply pipe it to a TCP port.
* **filter** - how to interpret the log data
* **output** - where the data goes. In this case, we send it to the linked elasticsearch container.
You can see from the above how setting this up using Docker Compose is making our life simpler. Rather than needing to identify hosts and IPs, we just tell Logstash it needs to look at "elasticsearch" and providing the containers are named appropriately, Docker Compose will do the rest.
The main work involved here is in setting up the filters. Our example has three parts:
* **multiline** is important for log appenders like Log4net, which output stack traces and similar long statements across multiple log lines. Ours has the following settings:
* pattern => "^%{TIMESTAMP_ISO8601}" - each new line begins with a timestamp.
* negate => true - inverts the filter, so lines *without* a timestamp are assumed to continue the previous line.
* what => previous - tells logstash that lack of a timestamp continues the previous line
* **grok** is the actual filter which is used to interpret our logs. More on creating this in a moment.
* **date** tells logstash to obtain the timestamp from our log file, rather than the time the log was ingested. Here we tell it to look at the field 'timestamp' extracted by grok, and use an ISO8601-style format to interpret it. (There's a small gotcha in that date is more finicky about ISO8601 timestamps than grok in general; my log file's timestamps aren't perfectly valid, so I need to use a manual format string here).
#### Creating a Grok filter
Now, that grok filter. Doesn't it look painful to build? Luckily, there's a website for that. It's called [Grok Constructor](http://grokconstructor.appspot.com/do/construction), and we want to use the [Incremental Construction](http://grokconstructor.appspot.com/do/construction) facility.
Firstly, paste some representative lines of your log in the "Some log lines you want to match" panel. Next, add any multiline filter. For mine, I add *^%{TIMESTAMP_ISO8601}* in the text box then click "negate the multiline regex" because it's negated in my file. After this, scroll up and click "Go!". Check that any multiline filters have been correctly applied!
Grok Constructor will give you two options for building each part of your expression:
* A fixed regex. Use this for common strings and formatting characters.
* A Grok expression. Use this to actually get data from the logs.
Because my logs start with a timestamp, I click the %{TIMESTAMP_ISO8601} radio button and give it a name of "timestamp" in the textbox above that section:
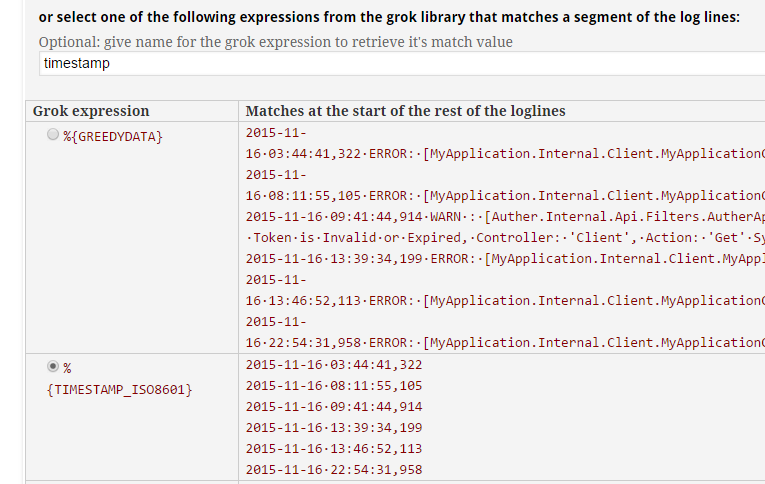
Click "Continue!" at the top and you will get the first part of the Grok expression:

We can now continue by choosing appropriate matches for each part of the log file string:

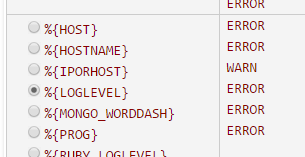

When you get past the point of all useful common fields, you can then finish up by using the %{GREEDYDATA} Grok expression. This tells Grok to grab everything else up to the end of the line.

When you're done, you should have a regular expression which looks something like the one in my configuration example:
`\A%{TIMESTAMP_ISO8601:timestamp} %{LOGLEVEL:severity}%{SPACE}: \[%{JAVACLASS:assembly}] %{GREEDYDATA:details}`
Copy this and paste it into your logstash file. You're now ready to stand up the ELK stack!
#### Getting it running
In the directory with your docker-compose.yml file, type the following:
`docker-compose up`
This will pull the necessary containers and start them up, printing all ouput to the console. You can now go and look at Kibana by browsing to http://localhost:5601/ - don't forget to forward ports if you're running Linux in a VM and browsing from your host address. You can also check on ElasticSearch by looking at http://localhost:9200/, because we opened that port to the world - we'll secure that in a future instalment, but for now it can stay open to keep debugging simple.
Kibana will probably give you a Red status at first until ElasticSearch comes up. This should be relatively fast now while the log index is empty, but once you have a lot of data in the system it can take a few minutes before everything's ready. Since we're not running in daemon mode, you'll see status messages in the `docker-compose` console while all of this is happening.
#### Ingesting some data
At first, your Kibana screen will look something like this (excuse the dated Windows 7 install being shown off here) :
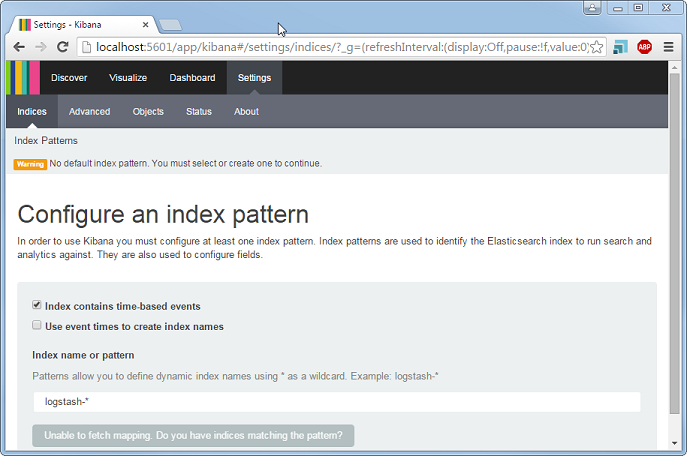
Ignore this for now - before we can create a useful index we need to get some data in there.
We told Logstash to listen on TCP port 5000 for some log data. So let's pipe some data to it. I've put my example log file in logs/applog_20151116.log, so to get data into Logstash I open up a new terminal and issue the following command from my working directory:
`nc localhost 5000 < logs/applog_20151116.log`
Because we're not running the Compose cluster in daemon mode (we didn't add `-d` to the `docker-compose up` command), we should see some log messages as the data hits ElasticSearch and it starts indexing. You can now go back to Kibana and create an index:
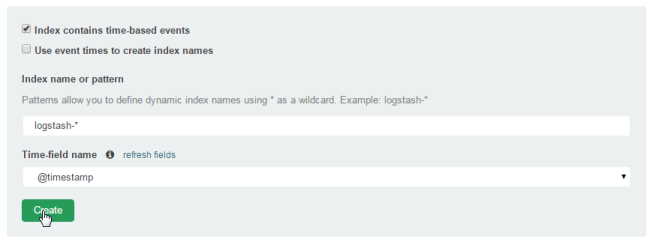
There's a really important step here, which is to check the following screen includes the fields you set up in the Grok expression:
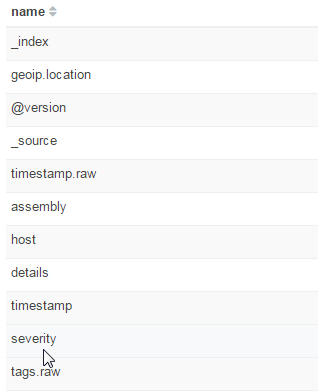
You can see here that my custom "severity" field and several others have been brought into the index. If that doesn't happen, it's because your Grok filter isn't correctly matching your log file lines. You'll need to go back to the Grok Constructor and tweak it until the log is correctly matched. Log messages printed by Logstash may help here - I found that in rare cases my local installation wouldn't have a pattern that was featured in the constructor.
To look at the data, go to the "Discover" tab of Kibana. You might not see any data here, in which case click on the timespan on the top right:

Select a larger range such as "Year to date". If the range is too large, you can click and drag on the bar chart to narrow it down, until you end up with something like this:
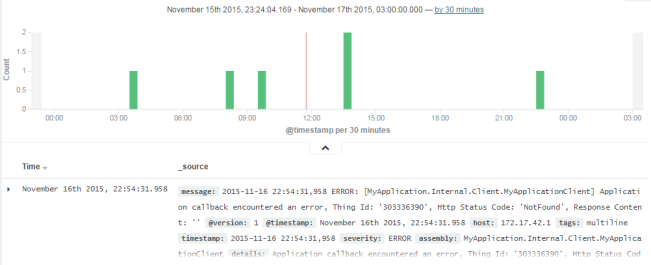
This is already more useful than a plain log file, but let's make it even more useful by creating a visualisation.
#### Creating a Visualisation
Click the "Visualize" tab, then select a visualisation - I'm going to use an area chart, but the principles are similar for all of them:

Next, click "from a new search". You can now add some *buckets* to split up the data. Add the timestamp to the X-Axis:

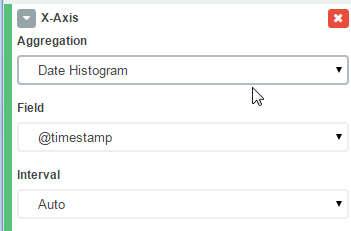
Then add another breakdown, this time by severity. (If you're using your own log files, you might have a different metric to use).


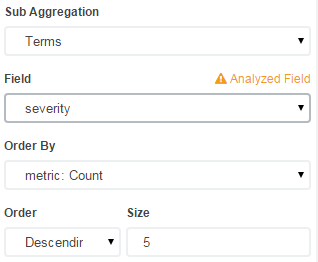
The graph won't immediately update, so click the green Play button to apply the changes:

Now we have a chart!
You can then save the visualisation by clicking on the Save icon and giving it a name:

Obviously with only 6 lines in our example log there's not so much data to show. But, get a bit more data in there...
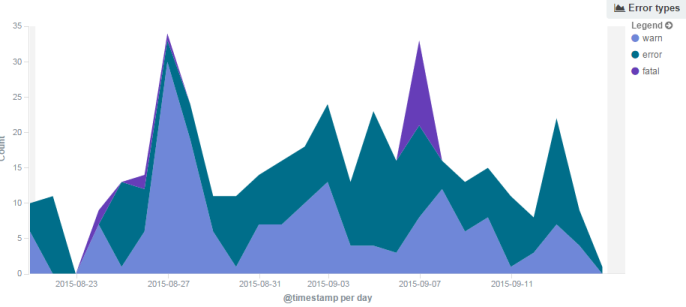
... and you start to have something more useful. Just looking at this graph, we know something bad happened on 7th September with a huge spike in fatal errors.
#### Finishing up
When you're done with the stack, you can press `Ctrl-C` in the terminal you're running `docker-compose` in to shut down the containers and return to the command prompt.
If you want to run the ELK stack without needing a terminal open, you can run `docker-compose up -d` to run in *daemon* mode. In this case, you can issue a `docker-compose stop` to cease the services.
#### Where next
There are a few things you might want to do to make this more useful in a production situation:
* Put an nginx reverse proxy in front of Kibana (or set up Shield) to allow authentication.
* Change the default configuration of ElasticSearch so it doesn't choke on large volumes of data.
* Set up persistent volumes so you don't lose your log data when a container gets deleted.
Next time: [Setting up a reverse proxy and authentication with nginx](http://mattkimber.co.uk/25-minute-elk-stack-with-docker-part-2/).
<sub>Image by Matt Kimber [CC-SA 3.0](http://creativecommons.org/licenses/by-sa/3.0/)</sub>