The Definition of Done Dashboard


I've been working on an infrastructure-heavy project of late, and one of the problems our team faced was differing viewpoints on what "done" actually means. In short, we ended up with a lot of variations of the following conversation:
"It's done, I finished it."
"But... I still see an error in my browser."
What we had was the classic disconnect between definitions of done. Each different person I talked to would give me a different definition. For example, for just one task we had four different opinions on whether it was done or not:
- DONE: "I checked it in and ran the build in TeamCity."
- DONE: "The configuration on the server looks correct."
- NOT DONE: "I can't load the login/splash screen in my browser."
- NOT DONE: "I can't do a complete end-to-end test of every component."
The solution was, naturally, that everyone needs to agree on a suitable definition of when something is "done". Ideally a definition that's trivially testable, where actual value has been achieved, but not something so unrealistically lofty that it will never be true. Finally, a good definition of done is very binary in nature: it isn't open to interpretation and he-said, she-said sorts of arguments.
What we settled on was the humble curl request. If everything we're working toward has a representative request that will succeed if and only if that thing is complete, then we have a clear and non-negotiable indicator of whether it's "done" or not.
This in itself is useful. But then I had another idea - what if, rather than having to proactively run the curl request to see if something is done, we can get it on a dashboard where anyone can see it?
One hour, 70 lines of Javascript and about 20 lines of Handlebars templates later, we had something much like this:
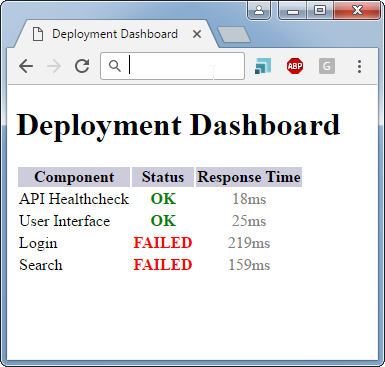
(I've anonymised the screenshot somewhat for this blog, we had about 10-12 components in our list.)
This is a really lo-fi tool (all I do is read a bunch of parameters from a JSON file, throw them through request, and see if the response I get matches what I've configured as the expectation) but if I throw it on a t2.nano instance and set up an appropriate security group I've suddenly got a link I can send out to my team and all of its stakeholders to answer the question: "is this done or not?"
What surprised me, even as an advocate of this sort of thing, is quite how much work accelerated once we all agreed on what was "done" and "not done". Something about having that big red FAILED status on the things we hadn't done made us concentrate on those, work out which were the most important ones to tackle, and get those to turn green. The dashboard also meant we knew if we'd made an obvious regression, rather than finding out when our tester or project manager started complaining about things not working any more.
The lesson here is that knowing where you're at is key for being able to deliver, the more visibly the better. And a major part of that is having a common definition of where "at" actually is.